GigaWealth                                     The classical approach to investing
 
Home > Investment Management > Investment Analysis > Assess Security  
 
Name: eBay Inc. Stock
Description: eBay Stock Analysis
Symbol: EBAY
Author: Chris Devlin
Upload graph, image or document
Embed video or application
Add hyperlink
 
(After adding new content (graph, video, hyperlink) click refresh)
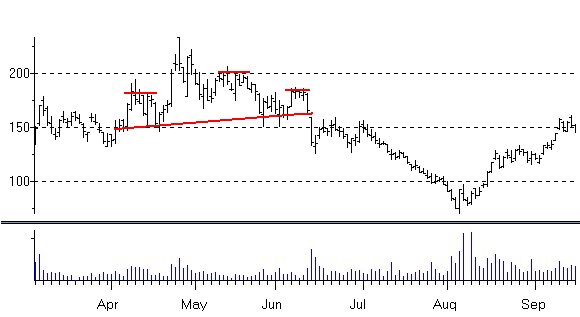
 
EBAY stock chart
 
EBAY stock drops 20%


Jim Cramer Calls EBAY Hapless Recommends Selling the Stock


Hyperlinks to relevant information
 
Stock Charting Software
 

Key Performance Indicator Analysis Summary   
Key Performance Indicator Importance   Current Assessment   Future Assessment  
1. 20-50-100 day Simple Moving Average     Important   Fair   Bad
2. 5-10-20 day Simple Moving Average     Important   Fair   Bad
3. 50-100-200 day Simple Moving Average     Important   Fair   Bad
4. Bollinger Bands     Important   Fair   Fair
5. MACD     Important   Fair   Bad
6. Parabolic SAR     Important   Bad   Bad
7. Price / Earnings Ratio (PE Ratio)     Important   Fair   Fair
8. RSI     Important   Bad   Bad
9. Stochastic Oscillator     Important   Fair   Bad
10. Stock Price and Volume     Important   Bad   Bad
11. Stock Splits     Important   Fair   Fair
 
Securities Analysis
1. Importance add commentary
2. Wisdom add commentary
3. Knowledge add commentary
4. Current Assessment add commentary
5. Future Assessment add commentary


© 2007-2010 GigaWealth Corporation - All Rights Reserved.